Deep Dive Diagnostics: Refining Bedrock's AUVs for Ocean Precision
As we continue our series, we dive into the work behind calibrating and characterizing Bedrock's fleet of autonomous underwater vehicles (AUVs). Bedrock’s summer 2023 ocean field tests were focused on refining our AUV operations. Here, we spotlight three field tests: AUV Fault Testing, Altitude Testing, and Navigational Testing.
AUV Fault Testing: Ensuring Reliability Underwater
The first in our series of characterization field tests focused on our system’s operational efficiency with the aim of establishing a baseline measurement for Bedrock's survey system when deployed in a realistic environment. We call this "operational efficiency" and it's measured by comparing the time we spend collecting data against the total time we're out in the field. This test showed that our baseline operational efficiency was hovering at 49%, with most of our efficiency losses related to debugging and resolving proper and accurate determination of AUV faults. Obviously, our immediate priority was to bring that percentage up because every moment of efficiency loss is time not spent collecting data, and at Bedrock, we are a bit obsessed with collecting data.
The team identified two main areas of opportunity for improving on this baseline – the first was fine-tuning the onboard Fault Detection, Isolation, and Recovery (FDIR) system. An AUV fault occurs when key metrics exceed defined thresholds, indicating a potential system issue and triggering predefined responses. This test highlighted the need to revisit those thresholds and responses. The second area of opportunity was in improving the display of information in the operator user interface to facilitate faster debugging. After implementing these changes, our operational efficiency shot up to 83% in the next field test and has remained consistently high in subsequent evaluations. These types of operational improvements are particularly exciting because they mean we get even more data even faster every time we deploy! For a detailed dive into this testing and its impact on our AUV operation, including specific fault examples, read the full report here.
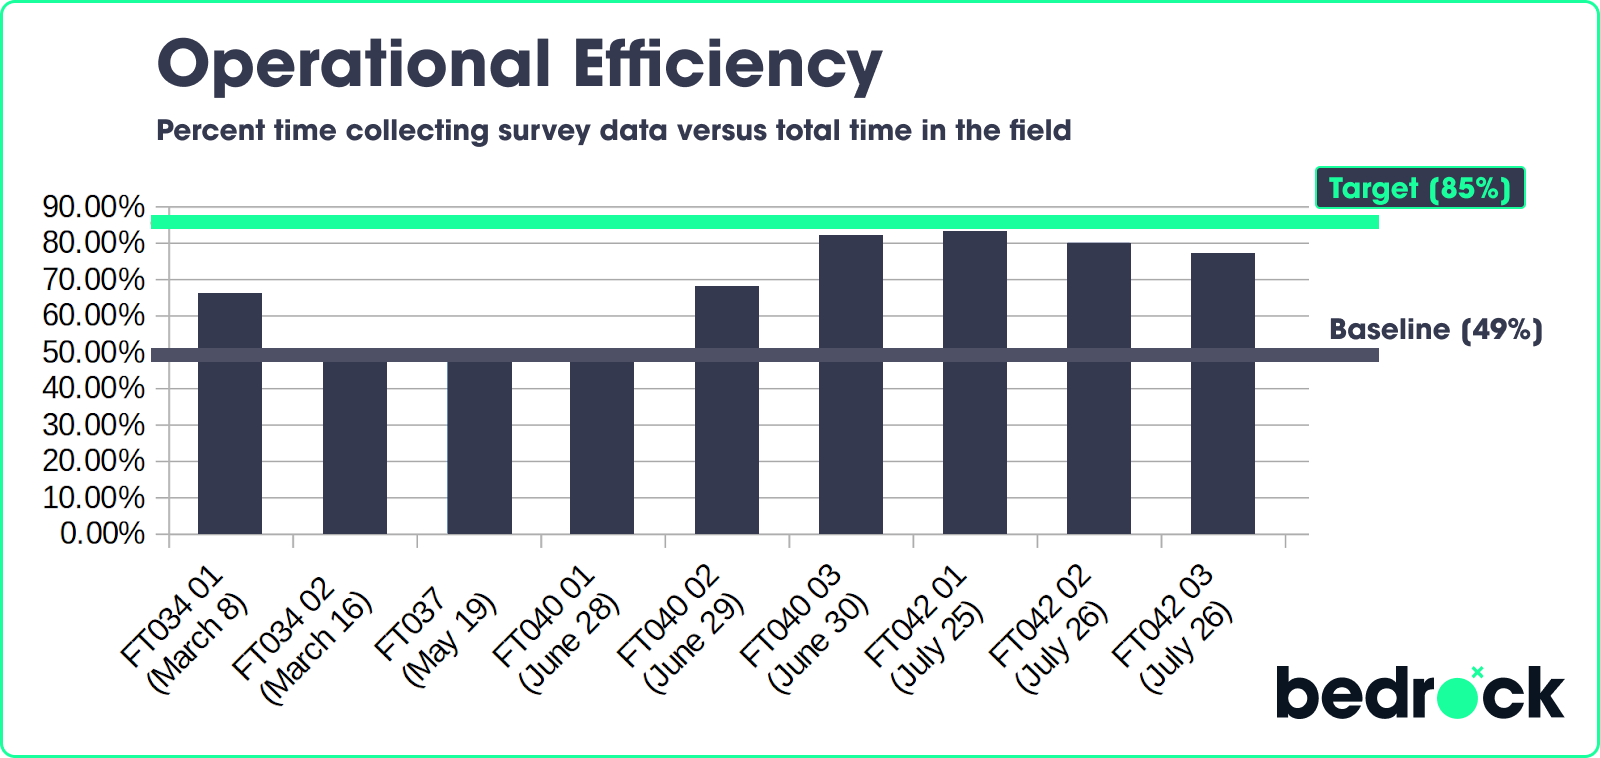
Figure 1. Operational efficiency charted for Bedrock ocean field tests in MBNMS through July 2023.
Altitude Testing: Balancing Resolution and Coverage
In our next field test we explored how varying the operational altitude of our AUVs affects the data quality through altitude testing – aka collecting data over the same spot at three different altitudes and evaluating how the data quality changes from one altitude to the next.
AUV altitude impacts bathymetry data by affecting resolution and coverage: lower altitudes provide higher detail and resolution but limit the survey area, while higher altitudes offer broader coverage with less detailed feature delineation. We found that our AUV altitude influences side-scan data quality minimally, maintaining consistent detection capabilities across altitudes, with variations in shadow lengths due to sensor perspective but not significantly affecting contact detection or surficial geological interpretations. AUV altitude certainly impacts magnetometer data, however the region surveyed here is magnetically quiet.
By conducting surveys at different altitudes over the same area, we gained invaluable insights into optimizing our AUVs for different survey requirements. This test highlighted the viability of Bedrock conducting initial high-altitude side-scan surveys to spot potential areas of interest, followed by more detailed, low-altitude surveys targeting these specific areas. For more detailed breakdowns of our data observations across all three lawns, check out the full report.
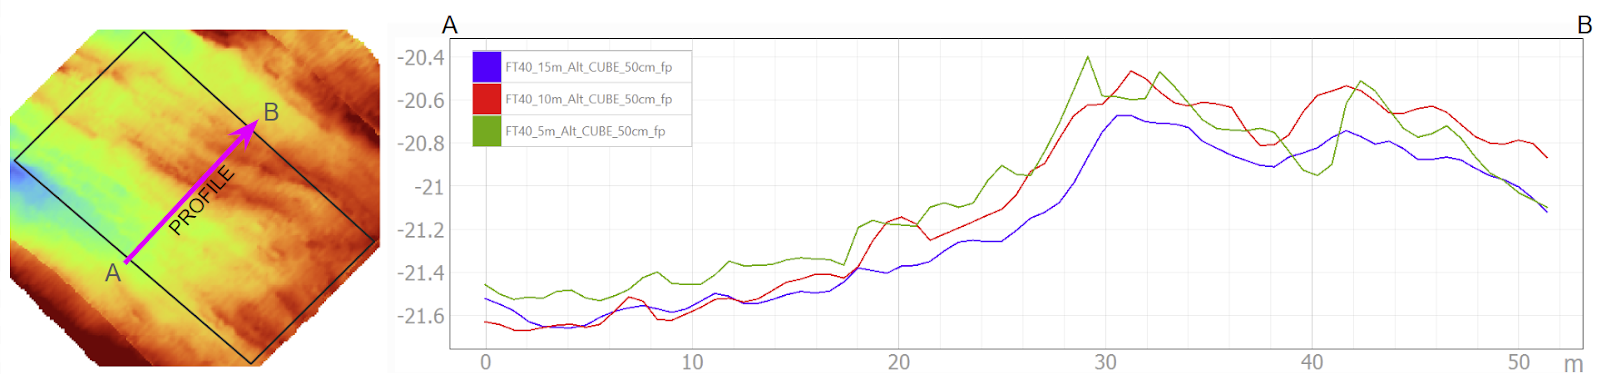
Figure 2. Map location of bathymetric profiles (left) and extracted profiles (right) of the bathymetric data gridded at 50 cm resolution for the 5 m (green), 10 m (red) and 15 m (blue) altitude lawns along the maximum regional dip orientation.
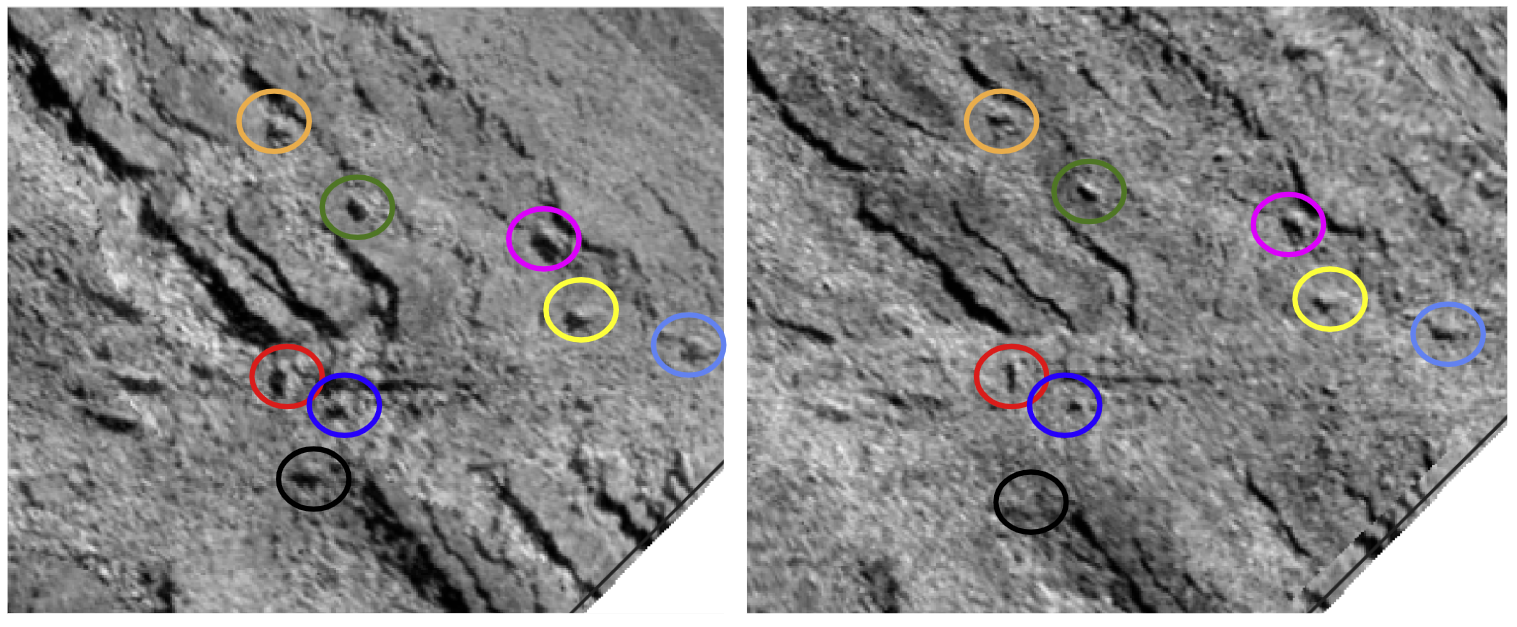
Figure 3. Sidescan mosaic at 10 cm resolution from the 5 m altitude lawn (left) and 15 m (right) altitude lawn. The same contacts can be identified on both images, with the main difference between these images being the length of the shadows.
Navigational Testing: Charting with Precision
In our last field test of the summer in Monterey Bay National Marine Sanctuary we focused on evaluating our navigational uncertainty. Accurate navigation is the heart of reliable seafloor mapping, and this test was designed to assess the performance of our Doppler Velocity Log augmented inertial navigation system (INS), and our Global Navigation Satellite System (GNSS) measurements against known topographic features. In this field test we executed a large survey area with multiple tie line crossings in order to evaluate how navigational uncertainty accumulates over distance traveled underwater. We picked out some big, easy-to-spot features on the seafloor that showed up on multiple survey paths and used them as reference points. We then adjusted their positions so they'd line up and look the same on different survey lines. This step-by-step check helped us see how our navigation accuracy changed over time. The results indicate that Bedrock AUV's INS navigation error grows a little bit for every meter it moves underwater, by about 0.0014 to 0.002 meters per meter traveled.
Informed by these results, Bedrock can execute surveys that perform to almost any hydrographic standard. Because the navigation error increases at a steady rate as we travel underwater, we can plan our missions so the AUV pops up for a GNSS update before the error gets too large. This way, we keep our measurements accurate and stay within the tight standards for underwater mapping. For a closer look at our navigational testing and even how we compare to International Hydrographic Association standard, see the full report here.
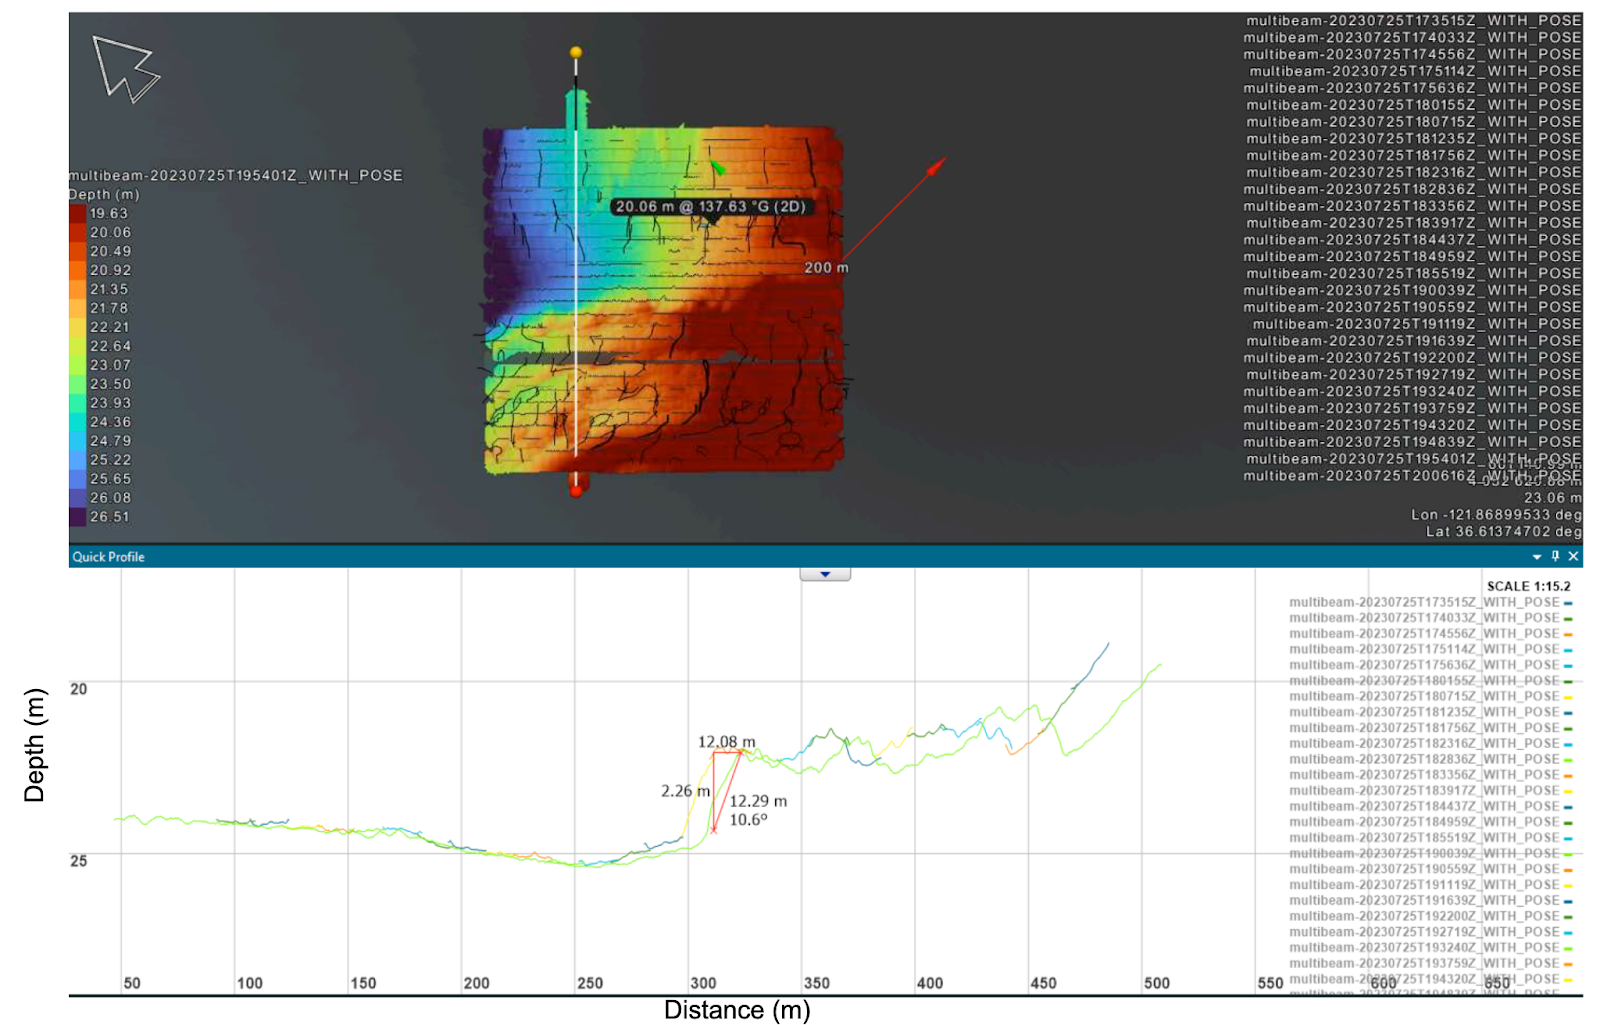
Figure 4. Example of geographic analysis comparing offsets between overlapping swaths of bathymetry data.
Beyond Calibration: Unveiling the Seafloor
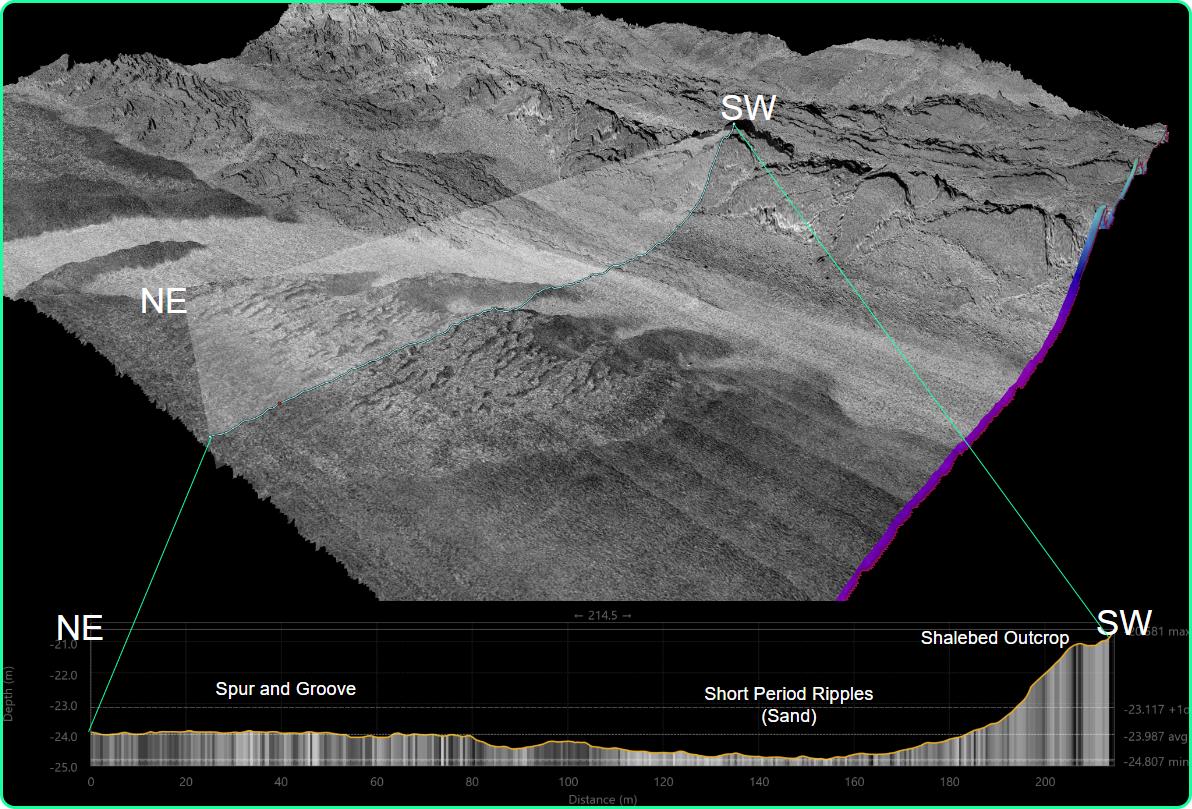
While our primary focus during this set of field tests was on refining and enhancing our AUV performance, an exciting byproduct of these expeditions is the rich tapestry of seafloor data we collected. Among these, Figure 5 stands out, offering a clear window into the dynamic interplay of sediment and current beneath the waves.
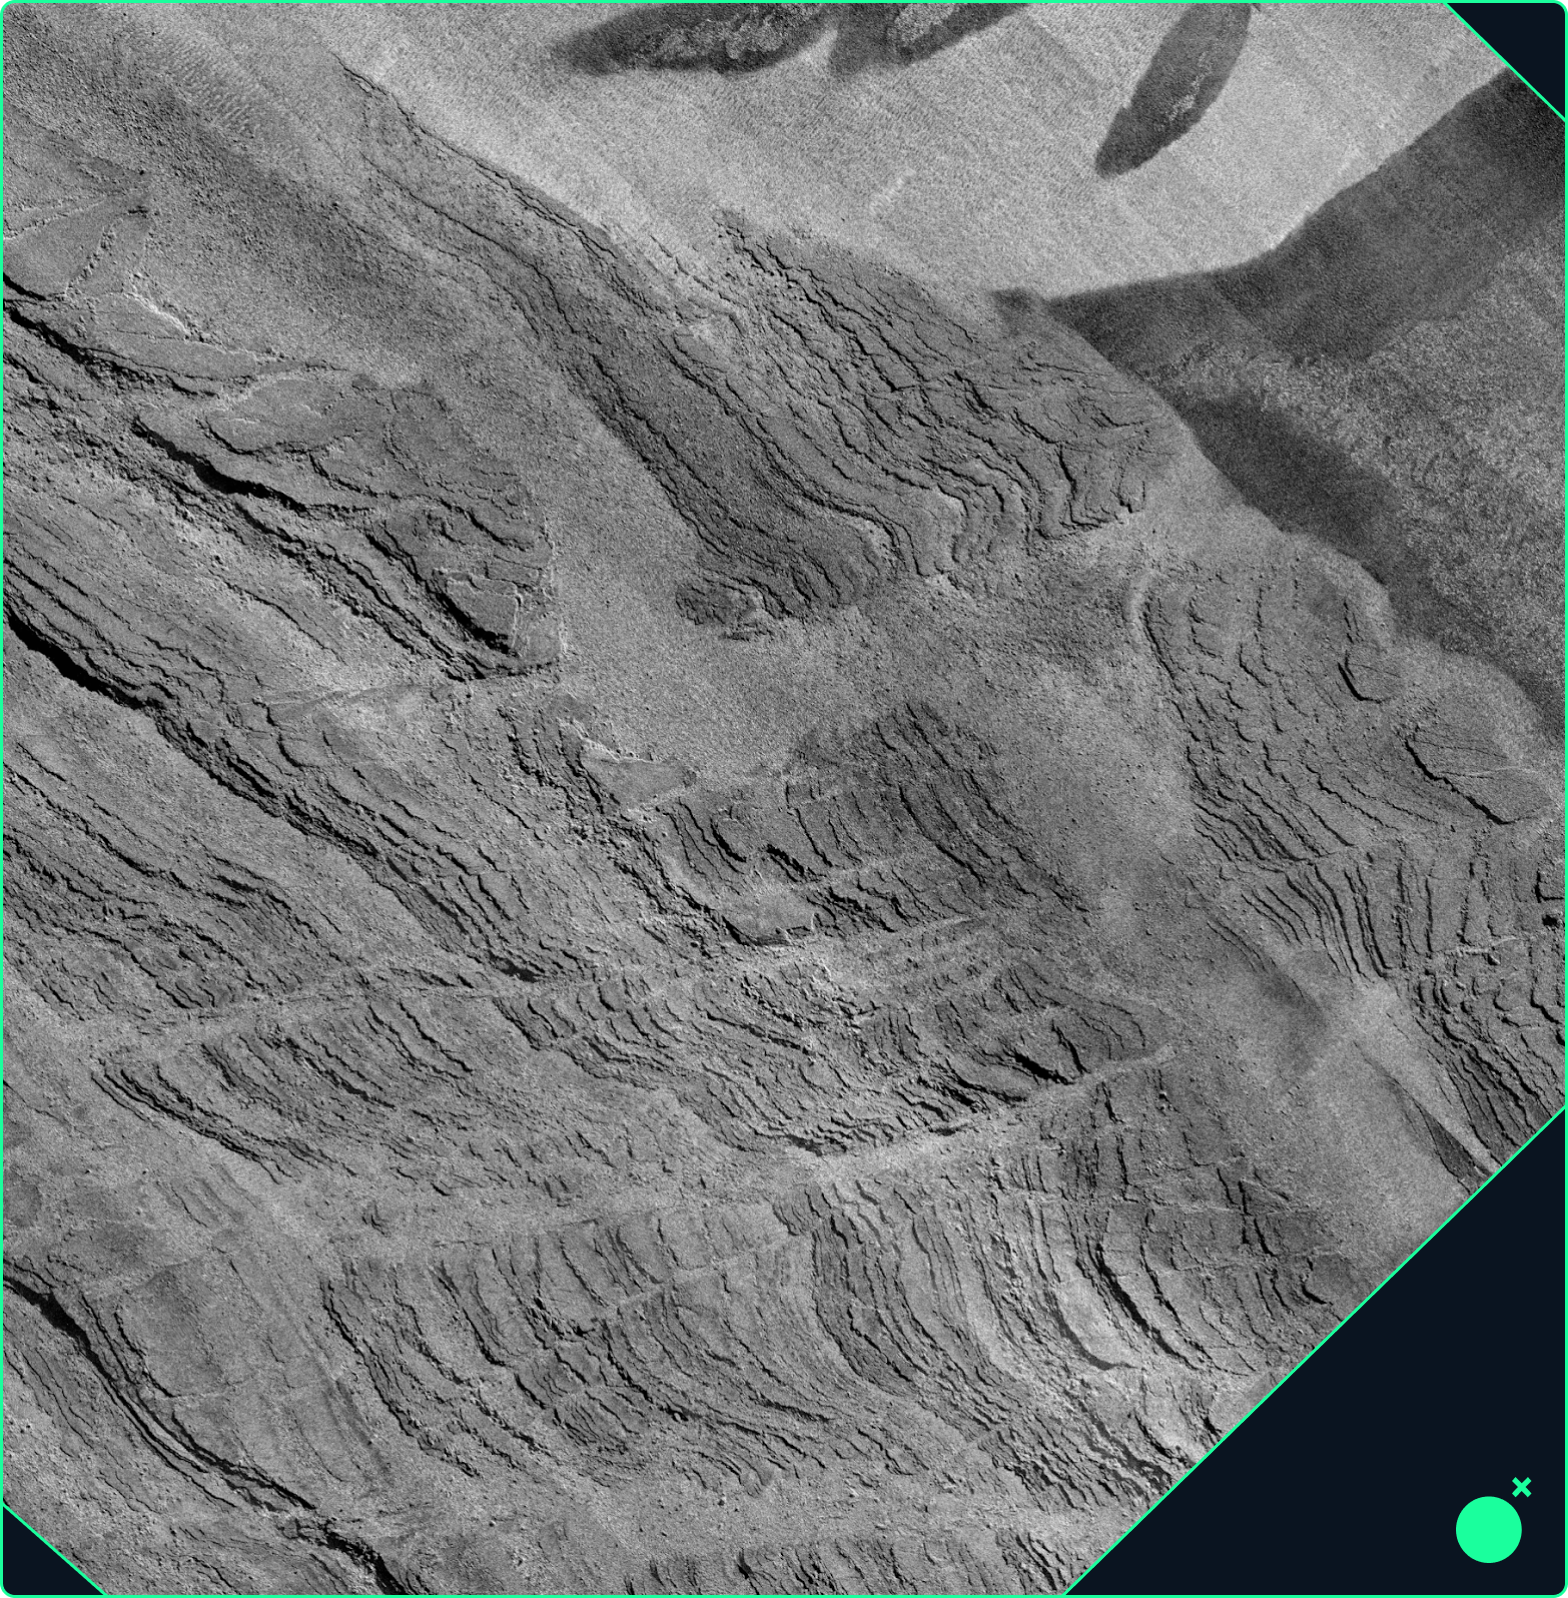
Figure 5. Side-scan Sonar data mosaic at 10 cm.
This side-scan sonar image reveals contrasting textures: sandy regions with distinctive ripple marks lie next to more reflective areas, suggesting varied sediment types and underwater currents shaping the seafloor.
Looking Ahead
These tests are more than just trials – they're stepping stones towards our goal of delivering precise, reliable, and efficient seafloor mapping solutions. As we refine our AUVs and their operations, we invite you to follow our progress and explore the data and insights that emerge from each test.
Stay tuned for our next post, where we'll explore a big step Bedrock took in 2023: Multi-AUV operations! In next week’s post we will discuss how we took the leap from operating one AUV at a time to simultaneously collecting data from multiple AUVs, unlocking the potential of our fleet capabilities.
Permit #: MBNMS-2022-023-A1