Sound beneath the waves
In the cold vacuum of Space, silence prevails. Whereas your eyes can detect light waves emanating from impossibly distant stars, there is nothing to tell you what those stars may sound like. There, in the absence of matter, sound cannot exist.
In places where matter is dense, however, sound can eclipse light as the dominant sensory signal. This is particularly true in the dark space that exists beneath ocean waves.
Unlike Space where lightwaves can travel vast distances without being scattered or absorbed, light can only travel short distances in water before it fades from repeated, energy draining collisions with water molecules. As a result, most of Earth’s ocean space exists in darkness, beyond the reach of both light and human exploration.
Marine animals have evolved to navigate, communicate, and hunt without light by using sound to illuminate their environment. And, increasingly, humans are doing the same.
Here, we’ll briefly explore how sound is being used by animals and humans to render ocean depths visible.
Sound in water
In late January, 1991, scientists floating off the coast of Heard Island (just south of Australia) powered up 5 speakers resting in the water below. At once, the speakers emitted a 200 decibel, 57 Hz sound that was heard three hours later by sound receivers located off Whidbey Island in Vancouver, Canada, as well as many others in Bermuda, British Columbia, and Southern California1.
The sound had traveled almost 12,000 miles.

Acoustic transmissions during the Heard Island Feasibility Test (HIFT) in 1991 followed geodesic paths to receivers located throughout the world oceans. Bdushaw, CC BY-SA 4.0, via Wikimedia Commons
Sound moves through space as a series of collisions between molecules. You can think of it as being similar to a cascade of falling dominoes: One domino knocks into another and, in so doing, transfers energy to it. That energy causes the receiving domino to move and knock into its neighbor, and the cycle continues. Seen from above, the falling dominos appear to move as a wave.
Instead of dominoes falling into one another, sound waves move as a result of molecules bumping into each other and then snapping back into place.
Because sound relies on the collision of molecules to spread, the speed and duration of sound travel depends on the density (and elasticity) of molecules in a given medium.
This is why the powerful sound waves emanating from the researchers’ speakers were able to travel around the globe—relative to air, molecules in liquids are much closer together, meaning it’s easier for them to bump into one another, and thus easier for the sound wave to move.
Sight through sound: How sound helps us see underwater
“If you cause your ship to stop and place the head of a long tube in the water and place the outer extremity to your ear, you will hear ships at a great distance from you.”
This quote from Leonardo Da Vinci in 1490 c.e. is the first known observation that sound can be used to detect distant objects in water. In the centuries that have passed, humans have developed elaborate methods for visualizing undersea landscapes using sound.
The basic premise is that sound waves emanate from a source (a transmitter) and collide with an object. Because the object is made up of molecules that are different from water molecules and have different physical properties (elasticity and density), some of the sound waves bounce off the object and are reflected back towards the transmitter.
An underwater microphone (sometimes called a hydrophone, or simply a receiver) can detect these reflected sound waves. Computers are then used to calculate how far away the object is, how big it might be, and various other details depending on how advanced the system is.
This is how sonar technology works (sonar is an acronym for “sound navigation and ranging”).
Sonar data can be collected to learn about the ocean floor.
Advanced sonar for undersea mapping and exploration
Situated nearly 10,900 meters (~7 miles) below the ocean’s surface, Challenger Deep is the deepest spot on the earth’s surface2. We’ve sent more people to the Moon than to the bottom of Challenger Deep.
There are many reasons for this, one of them being our inability to see.
As light fades in water, visibility is limited to shallow depths with very little light penetrating beyond 200 meters from the ocean’s surface (under ideal conditions). Only about 7% of the ocean’s surface area is within 200 meters of the ocean floor, meaning that >90% of the ocean exists in darkness3,4.
In the absence of light, sonar is handy; but even sonar is limited by distance.
As sound travels through water, it can encounter fish, bubbles, temperature gradients, salt gradients, and currents. Each of these alter how the sound moves5.
For sonar to work, it must be able to detect reflected sound waves and differentiate these from the myriad of sounds that exist under the sea. Because of this, the further away from the sound source and receiver you get, the more distorted the data will be.
Historically, sonar technology has been attached to the bottom of boats or affixed to submerged objects that are towed behind a boat. While effective for specific use cases, none of these options enable us to send sound waves down nearly 7 miles to the deepest parts of the seafloor and still receive a coherent signal at the surface6.
Rendering of NOAA Vessel using MBES to map bathymetric data of the ocean floor. Data on the depth of the ocean floor is color coded such that shallower depths appear more red, while deeper depths are blue. via NOAA
These limitations make it difficult for all sorts of seafloor mapping, not just at the deepest depths. Even in shallow waters, seafloor mapping is difficult and requires significant resources. This is changing, however, with the advent of autonomous underwater vehicles (AUVs).
Advanced AUVs are robotic submersibles that can be programmed to navigate to the ocean floor and collect data using sonar technology. The ability to embed sonar systems in AUVs that are smaller, cost-efficient, and low power means that parts of the ocean that were previously challenging or inaccessible to sonar are now within reach, both practically and economically.
The “autonomous” aspect is also a major advancement in the field because it enables sea floor mapping with far fewer resources, such as boats and the crews that operate them. AUVs offer a safer and, in many cases, a greener option as they don’t rely on fossil fuels to maneuver the ocean depths.
Currently, there are three types of sonar that are deployed in ocean mapping: Side Scan Sonar, Multibeam Echo Sounders, and Sub-bottom Profilers.
Side Scan Sonar (SSS)
This type of sonar pulses out sound beams in a perpendicular path from the source, providing detailed information about objects that may be located on the seafloor to either side of the AUV. SSS paints a detailed picture of the seafloor that is based on the intensity of reflected sound waves—hard objects (rocks, metal) will return strong sound waves, whereas soft objects (mud, sand) are associated with softer objects.
SSS systems have been used for decades in forensics and underwater mapping owing to its ability to generate a high level of detail about objects, leading to rendered images that are likened to pictures. However, it's limited by the technology’s inability to sense depth and built in assumption that the ground is flat7.
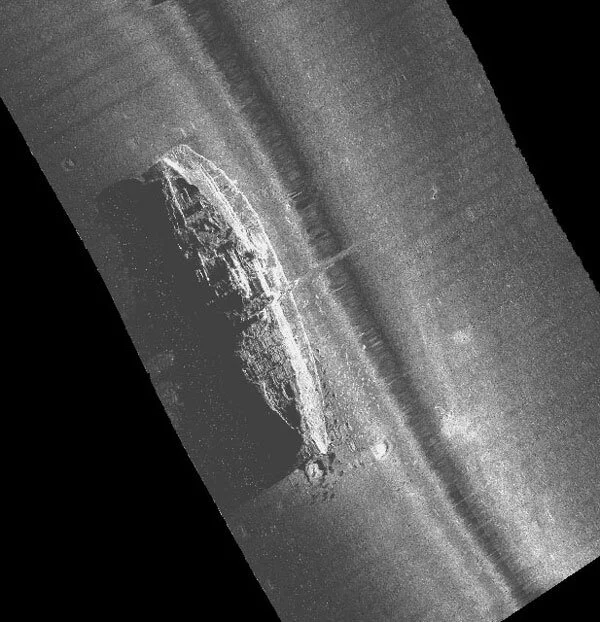
Side scan sonar image of the Steamship Portland, which sunk into the ocean off the coast of New England in 1898. via NOAA
Multibeam Echo Sounder (MBES)
This type of sonar sends out hundreds of narrow, laser-like beams of sound waves where each beam is arranged in tandem to provide a near uniform line of sound running perpendicular to the AUV’s path. By calculating the time it takes for a reflected sound wave to return to the MBES receiver, and sensing the reflected wave’s intensity, MBES provides data on the depth of the water (bathymetric data), items that may be in the water column—such as fish—as well as high level details about the seafloor’s topography8.

Multibeam bathymetry of Pao Pao Seamount (right) and an unnamed guyot (left). Image courtesy of the NOAA Office of Ocean Exploration and Research, Discovering the Deep: Exploring Remote Pacific MPAs. Via NOAA
Sub-bottom profiler (SBP)
This type of sonar uses very low frequency sounds to investigate what the seafloor is made of. Low frequency sound waves are less likely to be absorbed in water and can thus travel further than high frequency sound waves. SBP technology uses this property of sound to send low frequency sound waves deep into the seafloor. Based on the reflected sound waves, SBP technology can determine what layers of sediment exist well below the seafloor (around 20-50 meters deep)1-3.
When combined in an AUV, these systems—SSS, MBES, and SBP—provide overlapping datasets that collectively form a detailed picture of the seafloor, complete with nuanced geological, compositional, and bathymetric information3.
These systems also only represent the acoustic devices. AUVs can also carry magnetometers and conductivity-temperature-depth profilers that help layer in additional information about the seafloor and ocean column.
The toll of sound on marine life
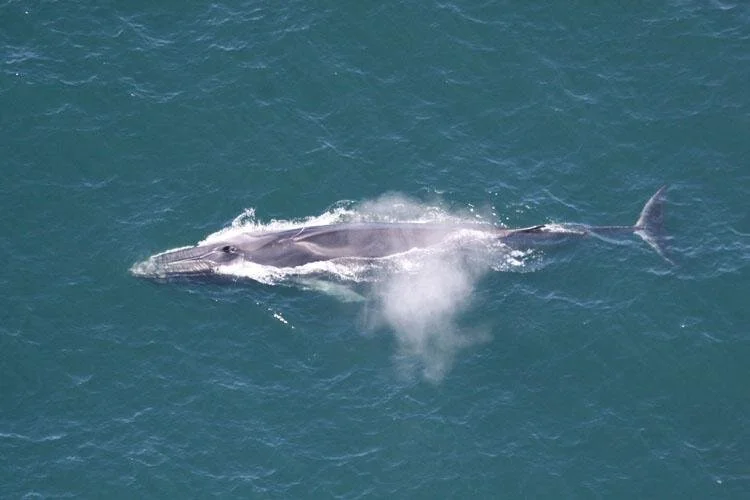
Sound can be a dangerous force, particularly for marine wildlife12-16.
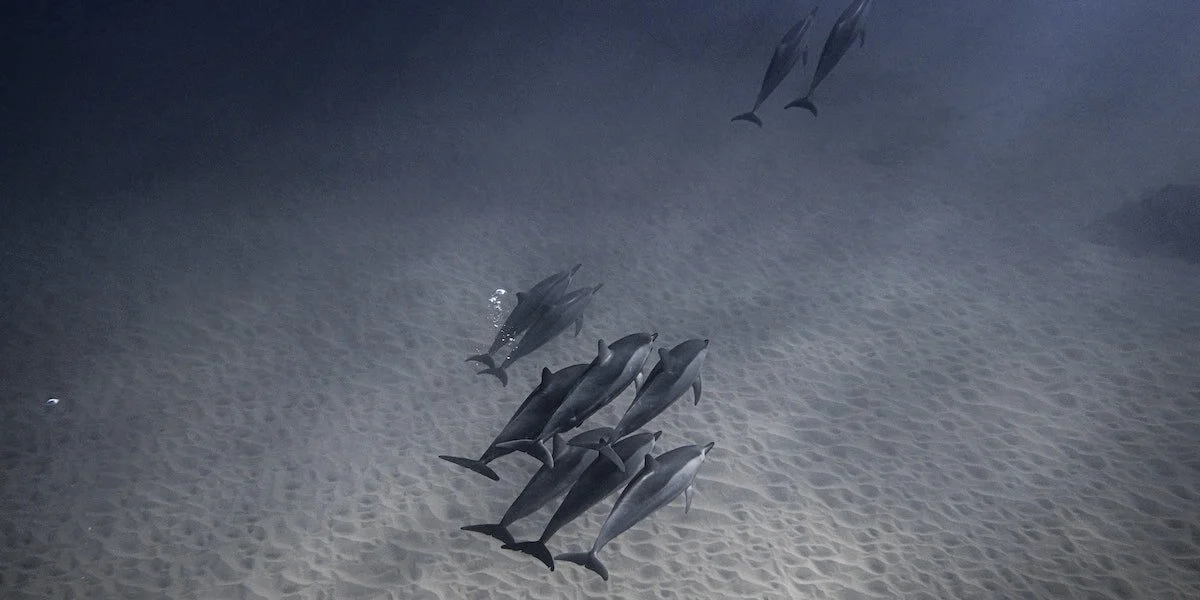
Marine mammals have evolved to see their environment through sound, emitting clicks, moans, and squeals that function like sonar.
For these reasons, there is a heavy emphasis in maritime technology on the use of sonar systems that are designed to have a minimal impact on the ecosystem.
Sperm whales, for example, use sounds ranging in frequency from 100Hz to 30kHz to navigate, hunt, and even communicate nuanced information about an individuals identity and belonging to family groups17.
The evolved dependence on sound, however, leaves them vulnerable to negative effects from sound emanating from human activity.
Sonar technologies, some of which use frequencies within the audible range of marine wildlife, can have a devastating impact on their physical health and long term behaviors12.
This is most obvious in the numerous documented events where sonar—often from military vessels—caused whales to become fatally stranded on beaches12,15,16.
Scientists believe that sonar can cause physical injury to marine wildlife when the intensity and frequency of the sound is strong enough. Sound is, afterall, a moving wave of energy. When that wave is strong enough and it collides with the molecules holding an animal together, it can cause blood vessels to break, organ damage, or the forming of gas bubbles in the animal’s bloodstream. All of these can cause death or disorientation that leads to stranding on beaches12,15.
Similarly, sound pollution from sonar and industrial shipping can have long term impacts on ecosystems by making it difficult for wildlife to hear and driving them to new, unfamiliar waters12,15
Bedrock AUV sonar technology
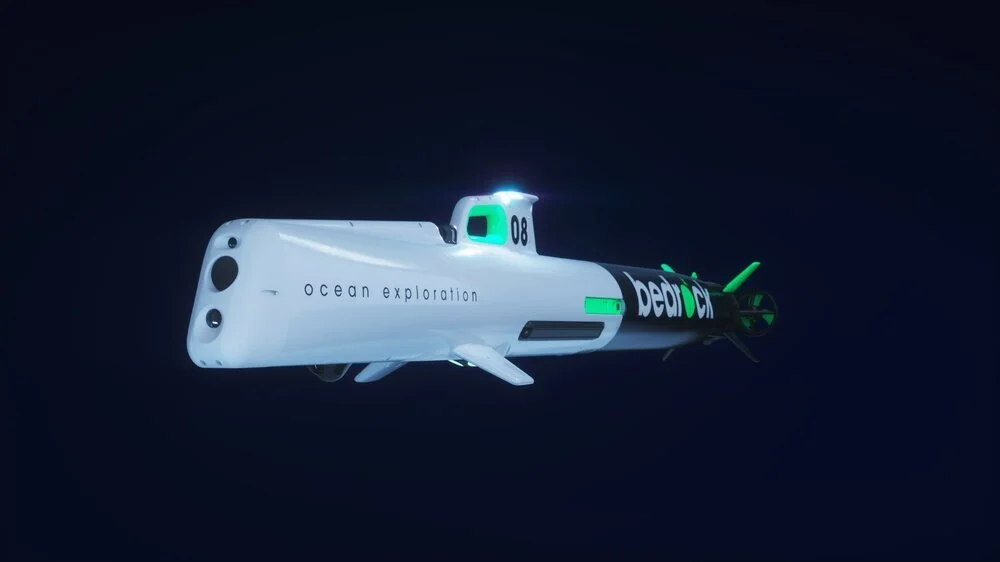
We’re now positioned to get an unprecedented view of the world beneath our ocean waves.
Bedrock’s fleet of Terrain Reconnaissance Inspection Platform Network-Class AUVs (T.R.I.P.N.-Class for short) embodies this potential.
T.R.I.P.N.-Class AUVs are equipped with SSS, MBES, and parametric SBP sonar systems to enable detailed mapping of the ocean floor. Importantly, because the AUV is able to bring the sonar to the ocean floor, these sonar systems can use higher frequencies that are above 200kHz. This enables higher resolution data to be gathered at a safe frequency; albeit at the cost of a smaller peripheral range.
Most marine animals have an auditory threshold that maxes out at ~160kHz13. By using sonar that is above 200kHz, you can decrease the likelihood of having a negative impact on marine wildlife.
When planning underwater mapping projects, whether for research or other purposes, project leaders are required to apply for permits that include a survey of all wildlife that are likely to be affected.
That T.R.I.P.N.-Class AUVs use 200kHz sonar is a significant advance because it greatly reduces environmental impact and simplifies the permitting process.
In heading towards ocean depths, Bedrock’s fleet of AUVs is taking the first steps by optimizing for projects that are within 90km of shore, and up to 300m depths. These first steps are likely to lead to a deeper understanding of what lies beneath our ocean waves.
References
Munk, Walter H., et al. “The Heard Island Feasibility Test.” The Journal of the Acoustical Society of America, vol. 96, no. 4, 1994, pp. 2330–2342., doi:10.1121/1.410105.
National Geographic Society. “All About the Ocean.” National Geographic Society, 9 Oct. 2012, www.nationalgeographic.org/article/all-about-the-ocean/.
Andersson, Andreas J., and Fred T. Mackenzie. “Shallow-Water Oceans: A Source or Sink of Atmospheric CO 2 ?” Frontiers in Ecology and the Environment, vol. 2, no. 7, 2004, p. 348., doi:10.2307/3868359.
“Know Your Ocean.” Woods Hole Oceanographic Institution, 30 May 2018, www.whoi.edu/know-your-ocean/.
Federation of American Scientists. PRINCIPLES OF UNDERWATER SOUND Chapter 8, Federation of American Scientists, fas.org/man/dod-101/navy/docs/fun/part08.htm.
“SONAR Equation.” Sonar Equation, Discovery of Sound In the Sea, 16 Sept. 2020, dosits.org/science/advanced-topics/sonar-equation/.
“Side Scan Sonar.” Exploration Tools: Side Scan Sonar: NOAA Office of Ocean Exploration and Research, NOAA, oceanexplorer.noaa.gov/technology/sonar/side-scan.html.
“Multibeam Sonar.” Exploration Tools: Multibeam Sonar: NOAA Office of Ocean Exploration and Research, oceanexplorer.noaa.gov/technology/sonar/multibeam.html.
US Department of Commerce, National Oceanic and Atmospheric Administration. “Our Deepwater Backyard: Exploring Atlantic Canyons and Seamounts 2014.” Mission Logs: September 24 Log: NOAA Office of Ocean Exploration and Research, 3 Oct. 2014, oceanexplorer.noaa.gov/okeanos/explorations/ex1404/logs/sept24/sept24.html.
“Chirp 512i - Sub-Bottom Profiler.” Chirp 512i, USGS, www.usgs.gov/centers/pcmsc/science/chirp-512i?qt-science_center_objects=0#qt-science_center_objects.
Kenny, A.J, et al. “An Overview of Seabed-Mapping Technologies in the Context of Marine Habitat Classification☆.” ICES Journal of Marine Science, vol. 60, no. 2, 2003, pp. 411–418., doi:10.1016/s1054-3139(03)00006-7.
Michael Jasny & Joel Reynolds & Andrew Wetzler. “Sounding the Depths II: The Rising Toll of Sonar, Shipping and Industrial Ocean Noise on Marine Life.” NRDC, 15 Dec. 2016, www.nrdc.org/resources/sounding-depths-ii-rising-toll-sonar-shipping-and-industrial-ocean-noise-marine-life.
Fisheries, NOAA. “Technical Guidance for Assessing the Effects of Anthropogenic Sound on Marine Mammal Hearing.” NOAA, 3 Aug. 2018, www.fisheries.noaa.gov/resource/document/technical-guidance-assessing-effects-anthropogenic-sound-marine-mammal-hearing.
Deng, Z Daniel et al. “200 kHz commercial sonar systems generate lower frequency side lobes audible to some marine mammals.” PloS one vol. 9,4 e95315. 15 Apr. 2014, doi:10.1371/journal.pone.0095315
“Effects of Noise on Marine Mammals.” Ocean Noise and Marine Mammals, National Academies Press, 2003.
Parsons, E. C. “Impacts of Navy Sonar on Whales and Dolphins: Now beyond a Smoking Gun?” Frontiers in Marine Science, vol. 4, 2017, doi:10.3389/fmars.2017.00295.
Oliveira, Cláudia, et al. “Sperm Whale Codas May Encode Individuality as Well as Clan Identity.” The Journal of the Acoustical Society of America, vol. 139, no. 5, 2016, pp. 2860–2869., doi:10.1121/1.4949478.